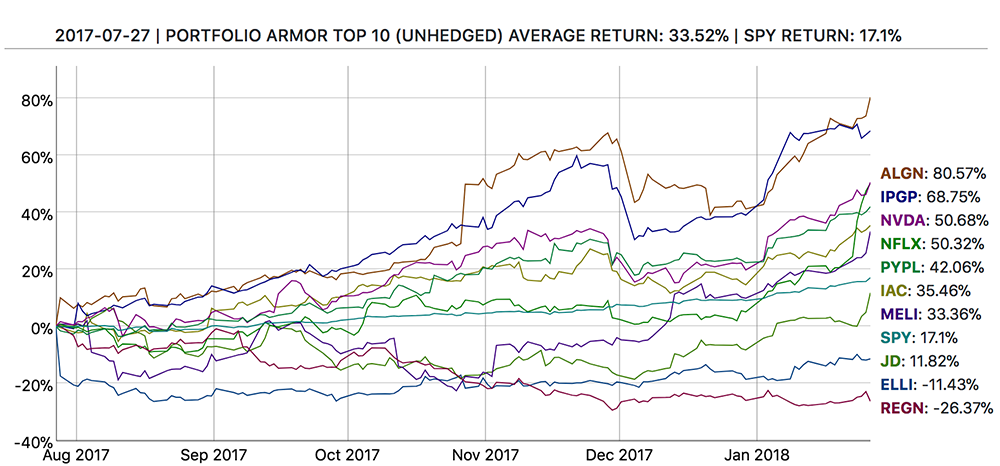

Every trading day, Portfolio Armor generates high-end estimates of how more than 4,000 stocks and exchange-traded products will perform over the next six months. These estimates are based on analysis of historical returns as well as option market sentiment, which provides a forward-looking element. We call this high-end estimate a security's potential return. Essentially, it's how the security might perform over the next six months in a bullish scenario. We backtested this method by running our analysis every trading day over an eleven-year period and then looking at the actual returns of the securities with the highest potential returns on our daily scans over the next six months. Over that 11-year period, we conducted 25,412 comparisons of our calculated potential returns to actual returns, an average of 9.4 top-ranked securities each trading day. The average potential return we calculated was 22.4%. The average actual return over the next six months, unhedged, was 6.84%. Since the average actual return was 0.3x the average potential return, we used that 0.3x multiple to derive expected returns from our potential returns. While a potential return represents a bullish upside, an expected return is the more likely result. In July of 2019, we began adding data from our top names generated since mid-2017 and tracked in real-time to our backtested data using a weighted average. We add new data every trading day and use it to refine our process. As of 2/7/2026, we now use a multiple of 0.2012 to derive expected returns from actual returns.
A subset of our top-ranked securities in our backtests had an even higher average actual return: 9.35%. All of our top-ranked securities were hedgeable with optimal collars, but the securities in this subset were also hedgeable with optimal puts (we call these AHP securities, for short). There aren’t always AHP securities available, but when there are, our portfolio construction algorithm gives preference to them proportional to their higher average returns in our tests. In our backtests, those returns were 3.23% higher than non-AHP returns, on average, over six months. In July of 2019, we began adding data from our top names generated since mid-2017 and tracked in real-time to our backtested data using a weighted average. We add new data every trading day and use it to refine our process. As of 2/7/2026, we now use a difference of 2.9114 to give preference to AHP names during our security selection process.
In June of 2022, we added an additional factor described here.